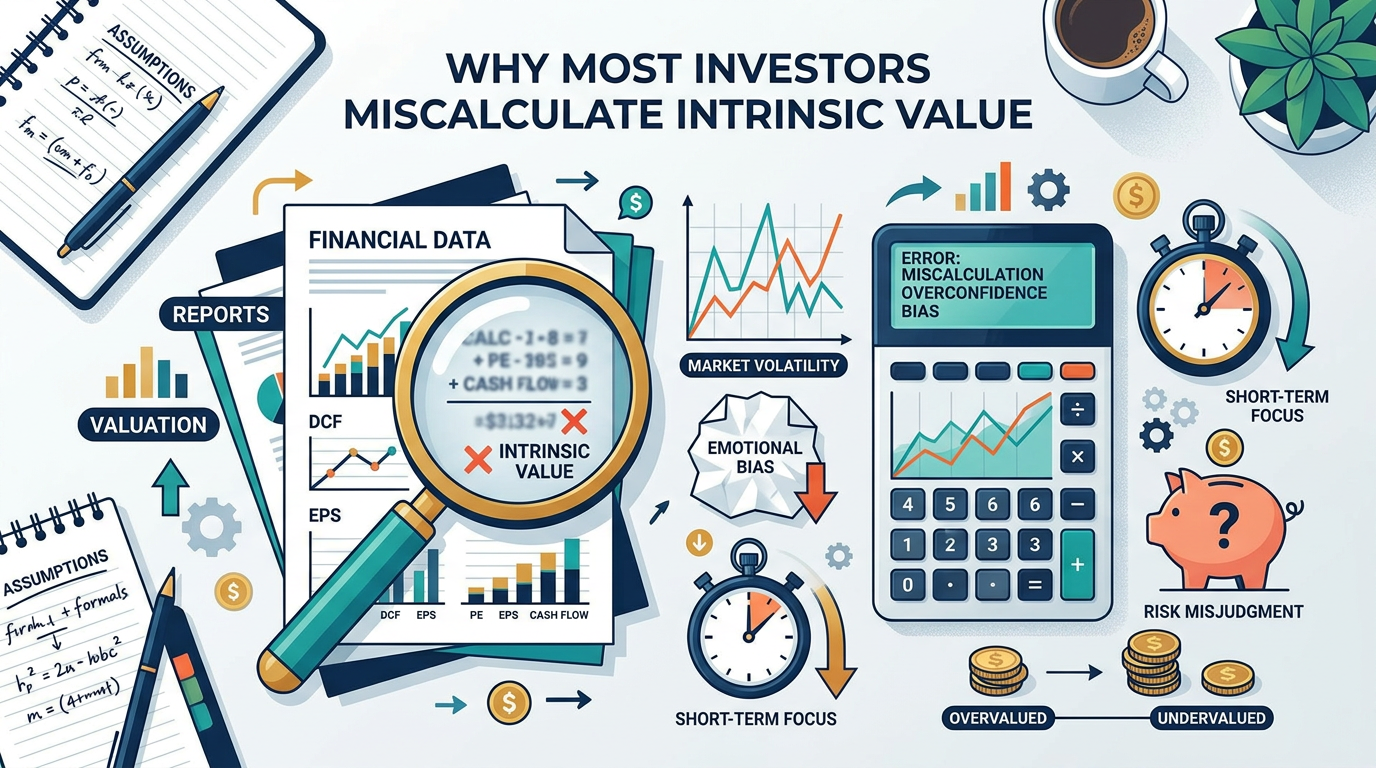
Why Most Investors Miscalculate Intrinsic Value
The most common intrinsic value mistakes retail investors make—growth optimism, discount-rate errors, terminal value traps, and how to avoid them systematically.
Intrinsic Alpha
Value Investing Research
You ran the numbers. You built the model. You bought the stock.
Then the company missed earnings for two consecutive quarters, the stock dropped 30%, and the valuation you were so confident in dissolved like fog at noon.
This is not bad luck. This is a miscalculated intrinsic value—and it happens to retail investors far more often than they realize, usually for the same handful of reasons.
The False Comfort of a Spreadsheet
A discounted cash flow model looks precise. It has cells, formulas, and a clean output: one number. That number feels like truth.
But Benjamin Graham warned us decades ago that intrinsic value is an elusive concept—not a precise figure, but a range shaped by assumptions. The moment you treat your model's output as fact rather than estimate, you've already made the first mistake.
Precision is not the same as accuracy. A DCF with five decimal places built on flawed assumptions is less useful than a rough range built on sound ones.
Mistake #1: Growth Rate Optimism
The most common error retail investors make is anchoring growth projections to recent performance.
A company grows revenue at 25% for three years. The investor extrapolates that rate forward ten years. The model produces a lofty intrinsic value. The investor buys.
What gets missed:
- Regression to the mean affects virtually every business eventually
- Large companies face a basic law of large numbers—25% revenue growth on a $300B base requires adding $75B of new revenue annually
- Competitive moats erode; distribution advantages shift; new entrants arrive
The institutional approach: Use multiple growth scenarios—base, bull, and bear—then weight them probabilistically. A single growth assumption is a guess dressed up as analysis.
Mistake #2: Ignoring the Discount Rate Sensitivity
The discount rate is the most powerful lever in any DCF model, and it receives the least scrutiny from retail investors.
A 1% change in the discount rate on a 10-year model can swing intrinsic value by 20–35% depending on the growth profile. Yet most retail investors plug in 10% as a default—because that's what they read somewhere—without questioning whether it fits the actual risk profile.
Consider what the discount rate must reflect:
- Opportunity cost of alternative investments
- Business risk specific to the company's industry and competitive position
- Financial leverage that amplifies both upside and downside
- Liquidity premium for less liquid or smaller-cap names
Using a generic 10% discount rate for a capital-light software business and a cyclical industrial company with debt is a category error. The rate must be earned.
Mistake #3: The Terminal Value Trap
Here is the counter-intuitive truth most retail investors never confront: in a standard 10-year DCF, the terminal value typically represents 60–80% of the total calculated intrinsic value.
Let that settle. You spend all your time stress-testing years one through ten—but the number that actually drives your output is the perpetuity you bolt onto the back end.
The terminal value formula is deceptively simple:
Terminal Value = (Final Year Free Cash Flow × (1 + Terminal Growth Rate)) divided by (Discount Rate minus Terminal Growth Rate)
A terminal growth rate of 3% versus 4% on a large-cap stock can shift intrinsic value by 15–25%. Yet this figure often receives less scrutiny than the near-term revenue forecast.
What disciplined investors do differently: They assume terminal growth rates close to long-run nominal GDP (2–3%), apply a haircut for execution risk, and then stress-test the terminal value independently of the rest of the model.
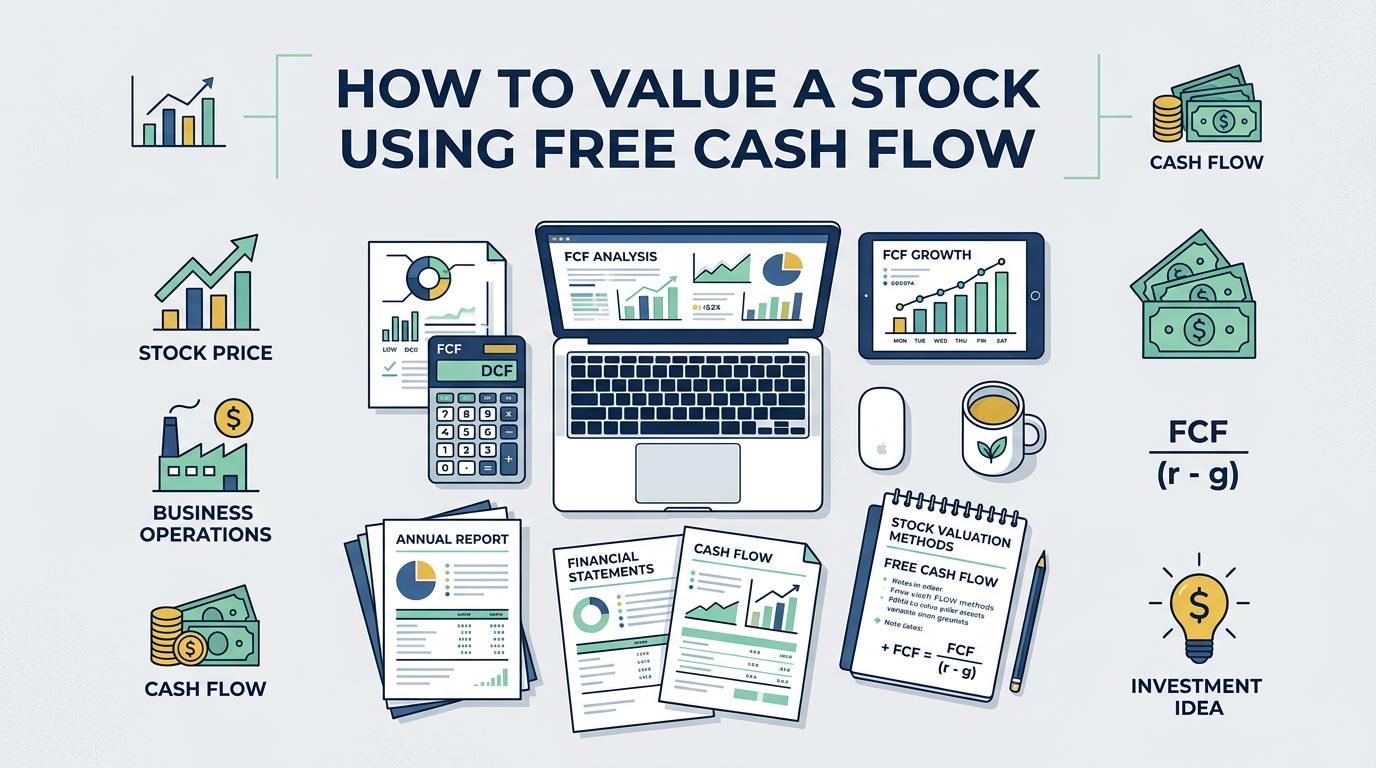
Mistake #4: Confusing Accounting Earnings With Cash Flow
Earnings per share is a reporting construct. Free cash flow is economic reality.
Retail investors frequently discount earnings rather than free cash flows, which introduces systematic distortions:
- Non-cash charges like amortization of acquired intangibles inflate earnings quality optically
- Stock-based compensation is a real economic cost, not just an accounting entry, yet it's often added back without scrutiny
- Working capital swings and capex intensity are invisible in an earnings-based model
- One-time charges get labeled "non-recurring" by management—even when they recur every year
The correct base for a DCF is owner earnings: operating cash flow minus maintenance capex, adjusted for the true cost of equity compensation.
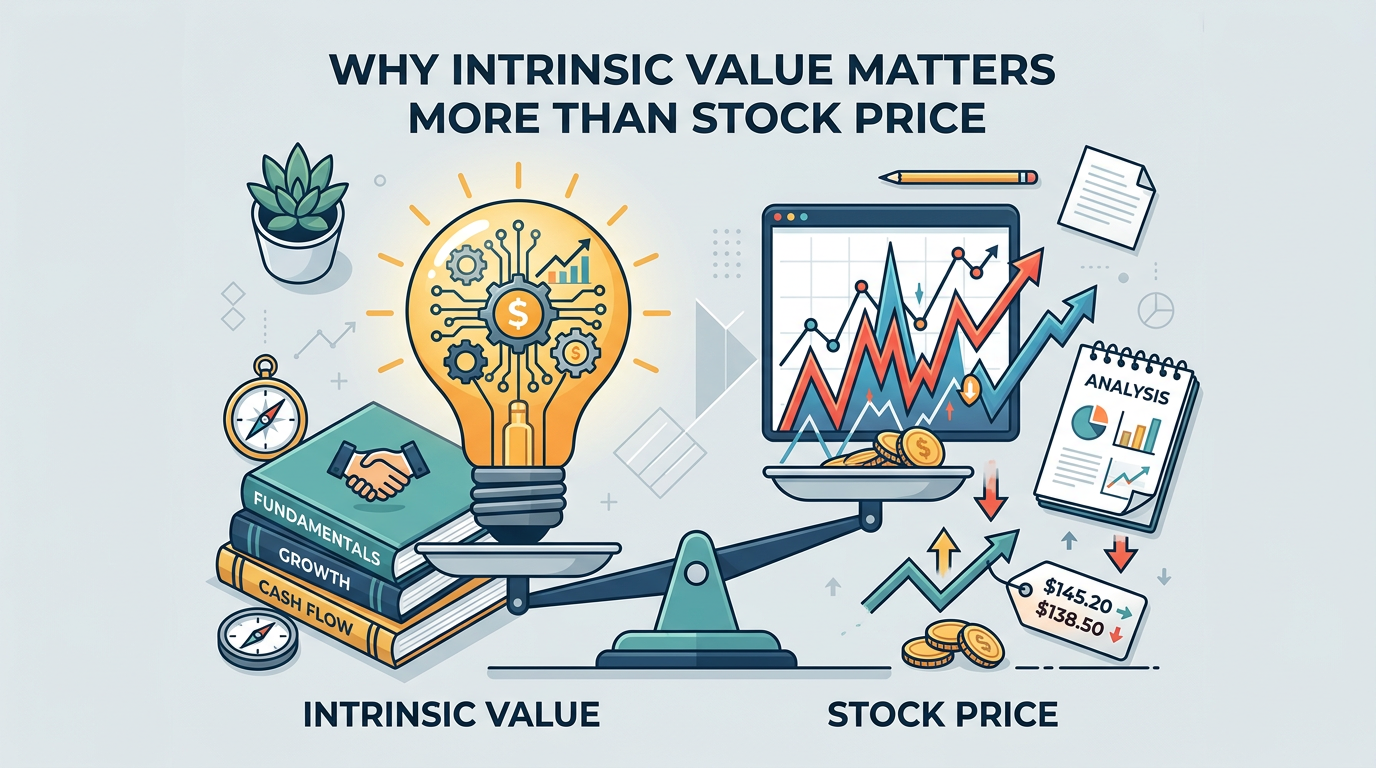
Mistake #5: Anchoring to the Market Price
This is the subtlest and most dangerous mistake of all—and the most common among retail investors who call themselves value investors.
It works like this: the investor sees a stock trading at $180. They build a model. Unconsciously—or sometimes consciously—the model's assumptions drift until it produces a number that confirms the stock is undervalued at $180. The model has not illuminated intrinsic value. It has rationalized the market price.
This is anchoring bias operating inside a spreadsheet.
The antidote is the reverse DCF—one of the most powerful tools in the valuation toolkit.
The Reverse DCF: What the Market Already Believes
Instead of asking "what is this company worth?", a reverse DCF asks: "what must this company achieve to justify its current stock price?"
You start with the current market price, plug it into the model as the output, and solve for the implied growth rate and return assumptions that make that price rational.
This reframes the investment question entirely:
- You are no longer arguing that the stock is cheap
- You are evaluating whether the market's embedded assumptions are realistic, optimistic, or borderline delusional
If the implied growth rate exceeds anything the company has achieved in its best historical years, the stock is priced for perfection. Perfection is rarely delivered.
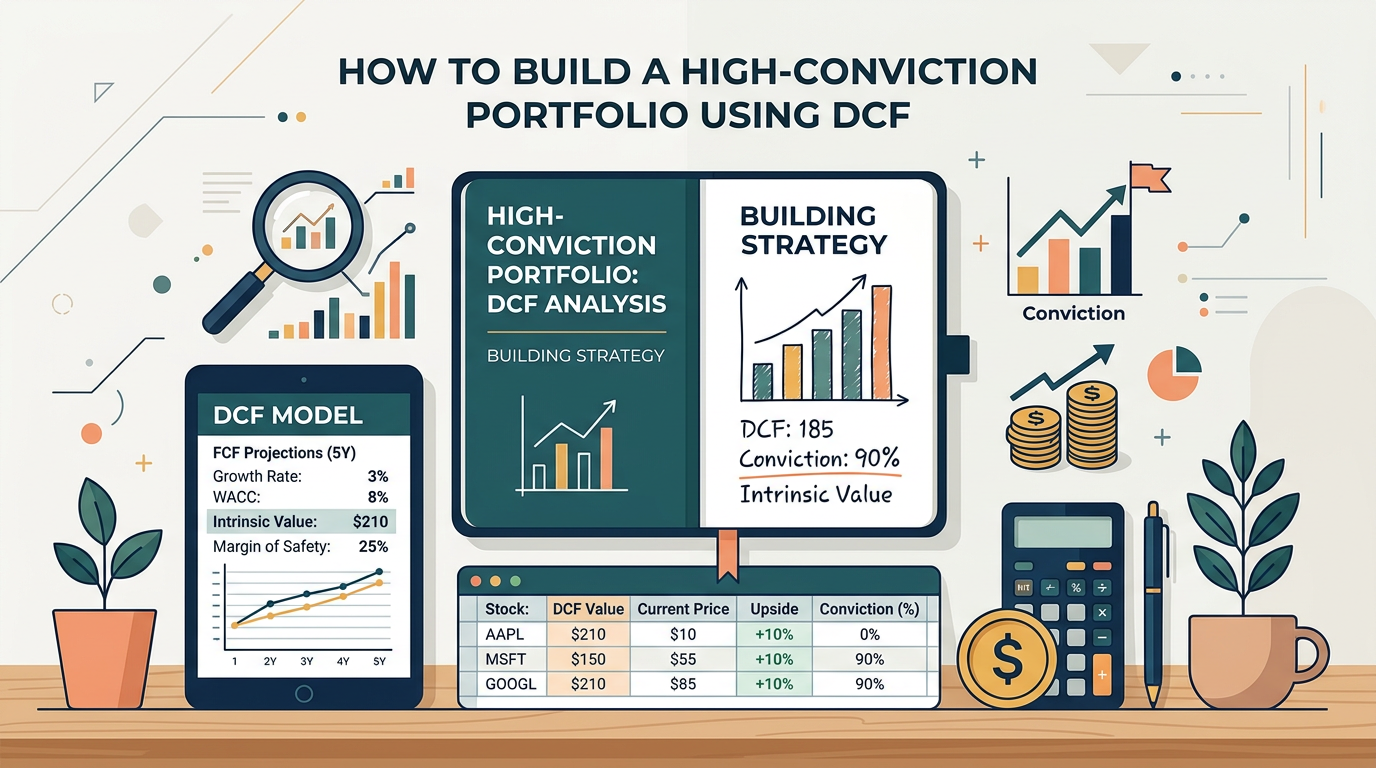
Building a Margin of Safety Into Every Model
Graham's margin of safety is not just a conservative platitude—it is a direct acknowledgment that models are fallible.
If your best-estimate intrinsic value is $150, and you buy at $148, you have no margin of safety. You are betting that your assumptions are precisely correct and that the business will execute without disruption.
A proper margin of safety—typically 20–30% for a stable business, 30–40% for a cyclical or early-stage one—means you only buy when the stock is meaningfully below your intrinsic value estimate. This single discipline absorbs the errors in your growth rate, your discount rate, and your terminal value simultaneously.
The margin of safety is not a buffer. It is the return.
What Wall Street Gets Wrong Too
It is tempting to assume institutional analysts avoid these mistakes. They don't—they simply make them with more sophisticated vocabulary.
Sell-side price targets are routinely reverse-engineered from narratives rather than derived from first-principles valuation. Consensus estimates cluster because analysts face career risk from radical divergence, not because the consensus is correct.
Retail investors who do independent, rigorous valuation work—correcting for the five mistakes above—can and do outperform consensus when they have the discipline to wait for the gap between price and value to close.
A Practical Checklist Before You Model
Before you commit capital based on an intrinsic value calculation, stress-test your work against these questions:
- Have you modeled at least three growth scenarios, not just one?
- Is your discount rate justified by the specific risk profile of this business?
- Have you stress-tested the terminal value at both 2% and 4% terminal growth?
- Are you discounting free cash flow—not GAAP earnings?
- Have you run a reverse DCF to understand what the current price implies?
- Does your margin of safety account for model uncertainty, not just business risk?
If you cannot answer yes to all six, the model is not ready—and neither is the investment.
The Bottom Line
Intrinsic value is a range, not a number. The investors who consistently get it right are not the ones with the most sophisticated spreadsheets—they are the ones who understand that every assumption is a forecast, every forecast can be wrong, and the margin of safety is what separates a good investment from a good-looking model.
The five mistakes above—growth optimism, discount rate carelessness, terminal value neglect, earnings-over-cash-flow confusion, and price anchoring—are not exotic errors. They are systematic ones. Eliminate them, and your valuation work will improve dramatically.
The market rewards patience and accuracy. It punishes confidence without calibration.